

So No More DCFs...
I used to value stocks with a discounted cash flow model. I stopped doing so because slight changes in the discount rate can completely change the valuation of a stock. And some stocks do not follow the science of the DCF method and have historically traded below their assumed value, even with discount rates generated by WACC. These days, I try to value stocks based on their earnings growth with some sort of end multiple.
Ok, so let's talk about Metrics
The earnings metric I prefer to use is EBITDA (earnings before interest tax depreciation and amortization). I use EBITDA because it helps compare companies that have different tax structures and can be used as a proxy for cash flow. I begin trying to value a company after I’ve analyzed it and can confidently state that I understand and admire their business model, market, metrics, balance sheet, and management team. More on this in another blog post!
I start by finding their most recent EBITDA number from their most recent annual report. Then I attempt to forecast their EBITDA 10 years into the future. This is the hard part, how do you predict a company’s EBITDA 10 years into the future? There are a variety of ways and it depends on the type of company you’re dealing with. Look at what the company has done in the past. If the company is a new and emerging startup who has grown their EBITDA at 40% every year, I would start with growing their next year’s EBITDA at a more conservative estimate, anywhere between 35-40% and then every year from then decreasing the growth rate, eventually making them grow at what a more mature company of their future market cap would grow at in the final years. If the company you’re dealing with is mature and grows at single digits, look at what similar companies have done in the past and what the industry is forecasting in the future. Once you have what you believe will be the company’s EBITDA number 10 years from now, it’s time to apply a multiple to your forecast. I use Enterprise Value / EBITDA, but this will depend on the earnings metric you’ve used. The purpose of applying the multiple is to convert your earnings metric to a price forecast. The magnitude of your multiple will depend on the company you’re dealing with. A fast growing tech startup has probably traded at extreme multiples in the past, don’t try to use their historic multiple on their future forecast, you’ll lose money. A mature company will most likely trade at a much lower multiple, it’s usually a safe bet to use their historic multiple to convert but you can even research into the future outlooks of the industry to generate your ending multiple.
PayPal as an Example
Woah that was a lot of words, let’s put this into practice with PayPal (PYPL), a fast growing tech company.
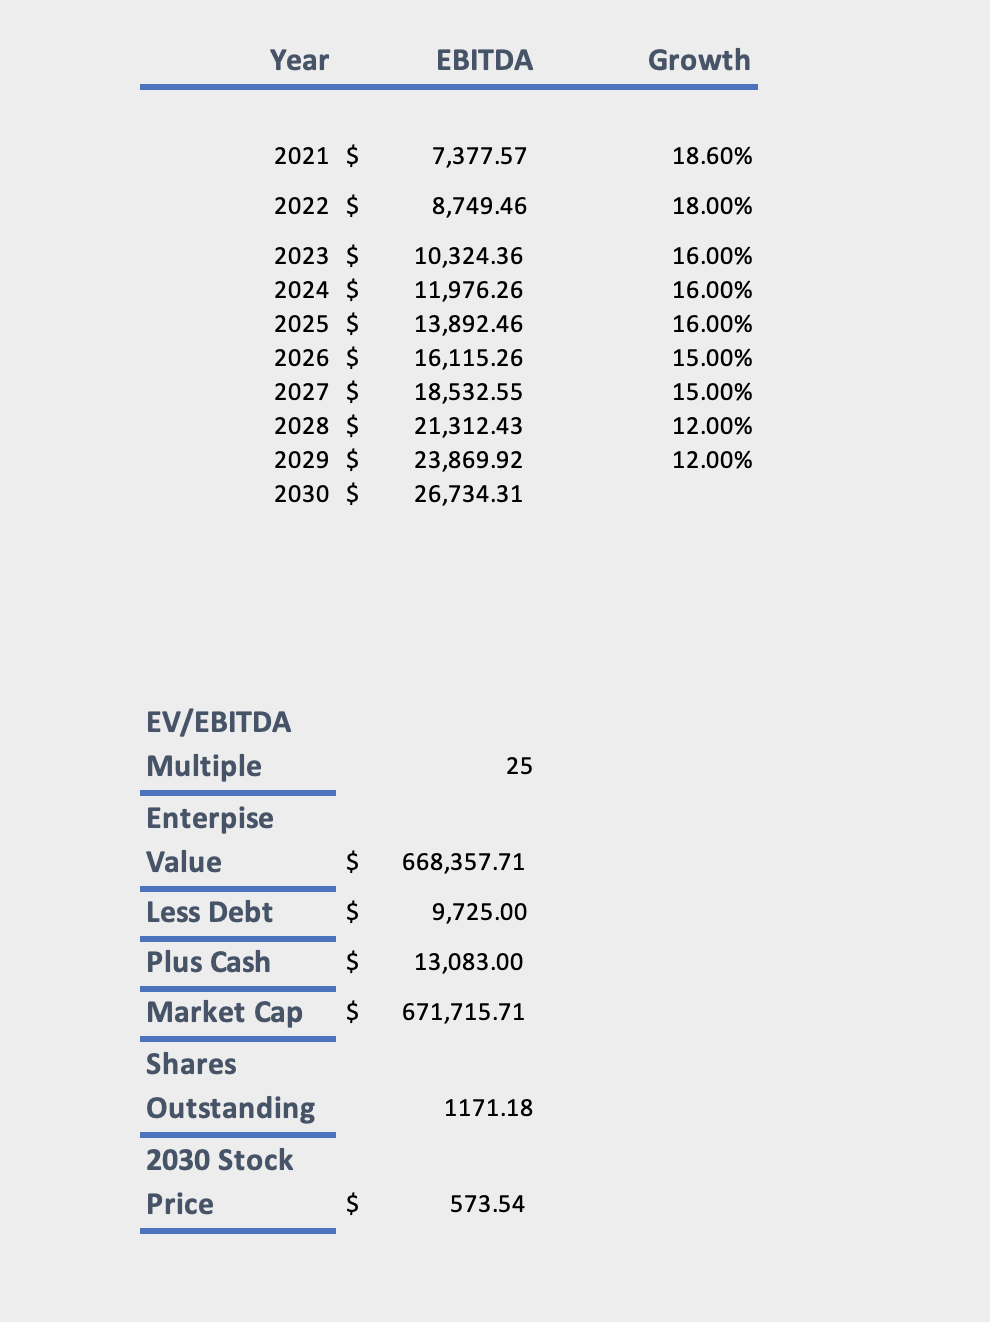
PYPL is expected to bring in $7.4 billion in EBITDA for 2021. Looking at historic data, PYPL has grown their EBITDA from $2.5 billion in 2015 to $6.1 billion in 2020, or around 20% year over year. I’m going to say that PYPL will begin growing at around 18% and drag that down to 12% by year 8 which should be conservative enough and similar to other tech giants. My next assumption is that in 2030, with PYPL growing in low single digits, they will trade at a EV/EBITDA of 25. This will be highly dependent on what interest rates are, but right now, a technology giant growing at 12% could trade around this level. This allows me to convert $26.7 billion of 2030 EBITDA to an enterprise value of $668 billion. Now let’s get to the market cap. Market cap equals enterprise value minus debt plus cash so subtract the $9.7 billion debt they have now, add the $13 billion of cash in their bank accounts, and we get to a market cap of around $665 billion. Divide by the amount of shares, and we have a 2030 share price of $573.54.
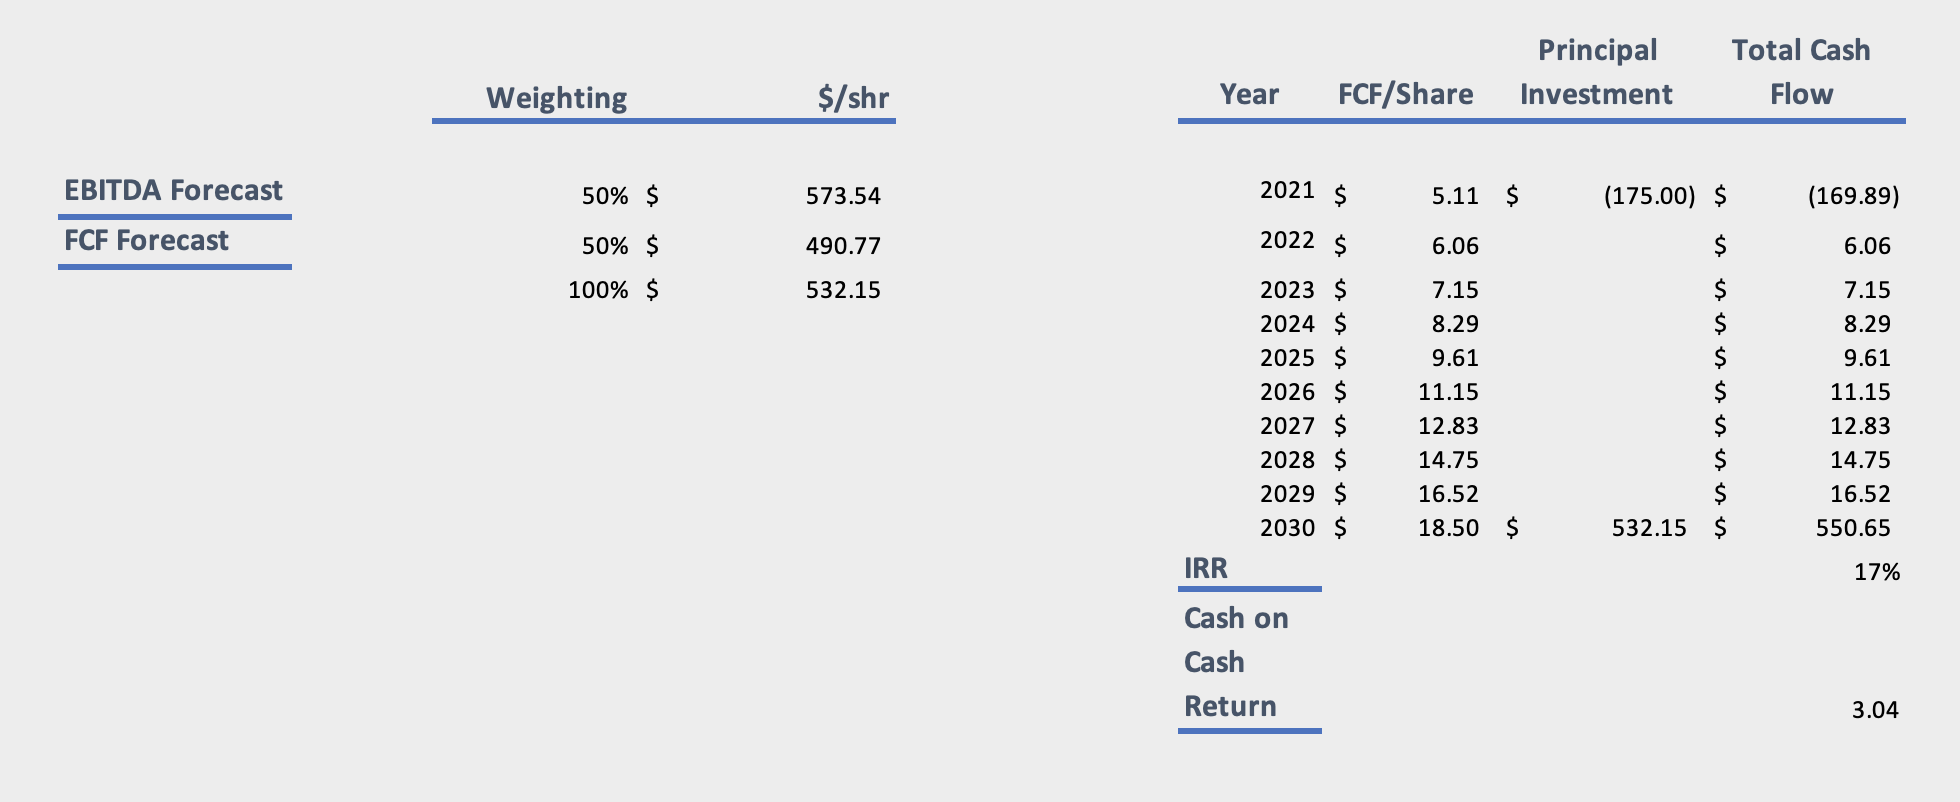
Now, that’s not usually all I do. I usually even build a stock price forecast of free cash flow so do the exact same steps above except with free cash flow per share (instead of EBITDA) and use a FCF yield as an ending multiple (instead of EV/EBITDA). Then I average the two forecasts to get my final predicted stock price. Additionally, there are many things that the company may do like buy back shares or make acquisitions. So when calculating my future returns, I don’t just divide what I believe the stock to be by what it currently is. I use an IRR calculation (more about that can be found here). This is what it would look like.
I hope you enjoyed!
The above references an opinion and is for information purposes only. It is not intended to be investment advice. Seek a duly licensed professional for investment advice.
That’s all I have! Now that you understand it, let's put these learnings into practice. If you’re excited about this space and quantitative finance, we love to hear more about why you’re interested and encourage you to get started by building your own trading model using Blankly. Want to learn even more or discuss your own investing strategy? Join our Discord and our newsletter.